
Australia’s low economic complexity – infographic
Given Australia’s advanced society many were surprised, disbelieving even, when the latest Harvard Atlas of Economic Complexity rated us low on the complexity scale.
Japan, Switzerland, and South Korea sit at the top of the ranking.
Czech Republic ranked 6th in the world while the US slipped out of the top 10 into 12th position.

The Power of Productive Knowledge
Highly ranked countries tend to have the following attributes:
• A high diversity of exported products

• Sophisticated and unique exported products (i.e. few other countries produce similar products)
In short, the ranking hinges on the concept of “productive knowledge” – or the tacit ability to produce a product.
Much like the rack of letters in a Scrabble game, the elements of every export-driven economy can be broken down and quantified. The resulting categories encompass everything from rendered pig fat to integrated circuits, each contributing to the country’s overall score.
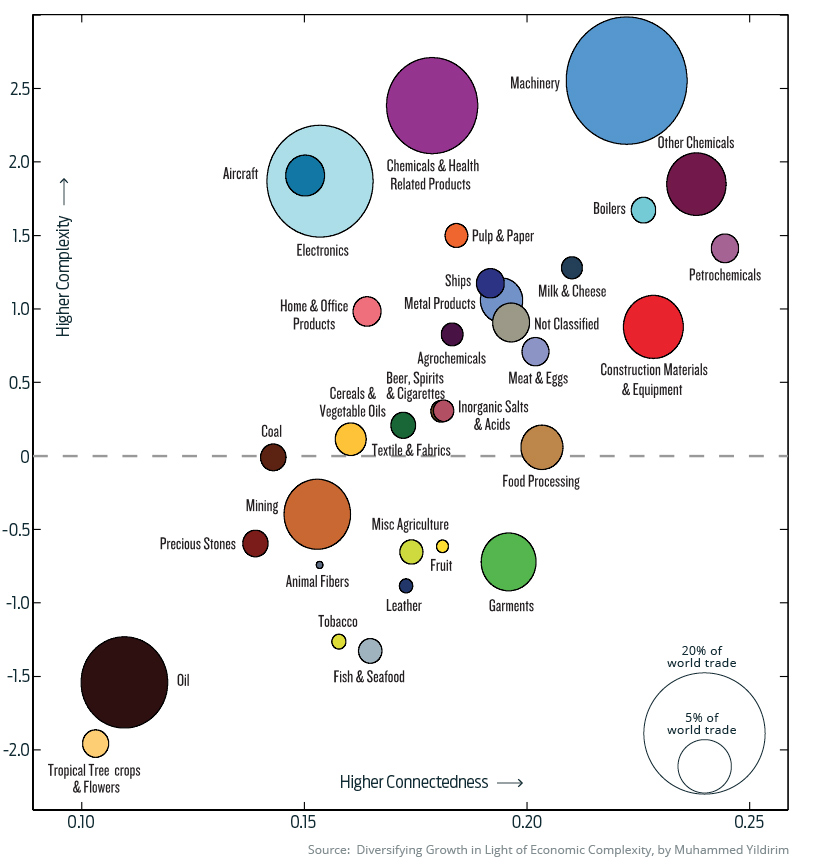
Agricultural and extractive industries tend to score lower on the complexity scale. Machinery can be highly complex to produce and is connected to many facets of the global economy.
Visualizing this overall mix of categories can provide a unique perspective beyond big picture numbers like GDP. Below are a few real world examples of export markets on both ends of the complexity spectrum.
Since this ranking began in the mid-1990s, Japan has never been bumped from the top spot.
Due to a restricted land mass and some ingenuity, Japan has become the prototypical example of a low-ubiquity, high-sophistication export economy.
At the other end of the scale is Australia, with the 93rd most complex economy in the world.
That ranks us on a par with Pakistan at 94, which is not a country Australians normally think are comparable. But they are.
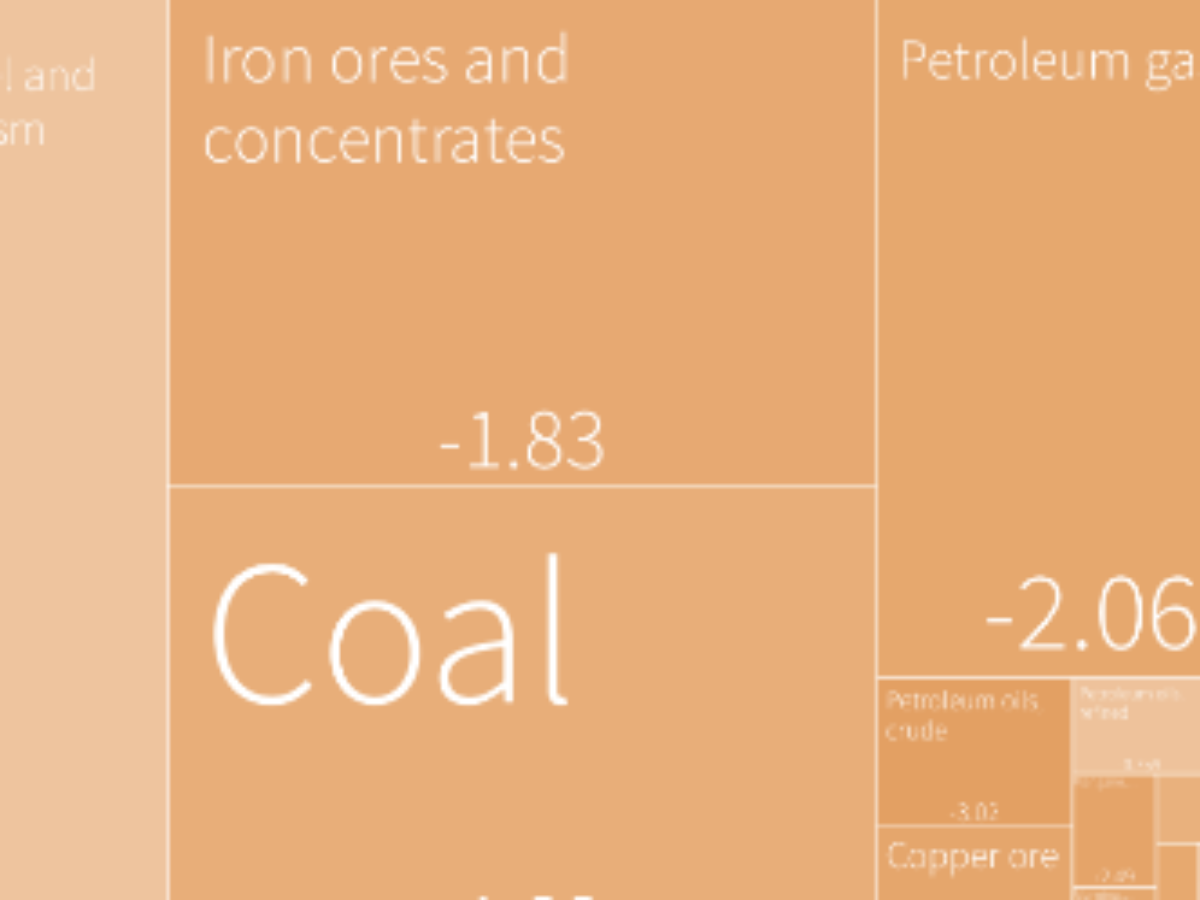
Although Australia’s global ranking is high in a myriad of categories – household wealth per person, for example – its economic complexity score is -0.60, much lower than expected for its income level. Looking at the breakdown below, there are clues as to why this might be the case.
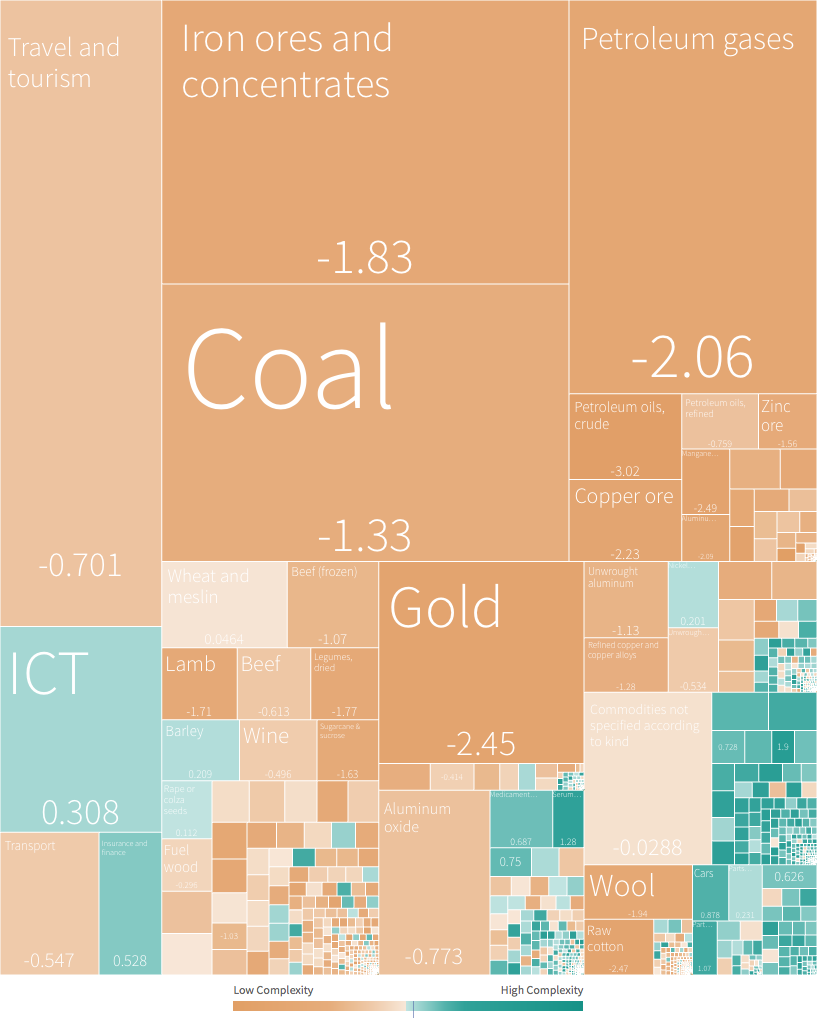
Australia’s largest exports are in low complexity categories, such as minerals and agriculture.
While we enjoy a balance of rade surplus overall this is not the case in so called elaborately transformed manufactures (ETMs) – all the iPhones ad computers, cars and machines we get from overseas.
In fact, we import $180 billion more ETMs than we export – and that deep deficit has to be paid for by other sectors of the economy.
To compound matters, Australia’s economy is heavily linked to a single country, China’s.
To underscore this point, a recent study found that a five per cent drop in China’s GDP would result in a 2.5 per cent dip in Australia’s.
A low level of economic complexity isn’t necessarily a problem. Many countries with middle-to-low scores in the ranking have great standards of living and a high level of wealth. Countries like Canada, Norway, and Australia were all well down the list.
On the other hand, some countries have made diversification a priority.
SoftBank’s $100 billion Vision Fund is partially the result of Saudi Arabia’s push to develop a diversified, knowledge-based economy.
Other oil-rich nations, such as Kazakhstan, are also pushing to diversify in the face of the world’s evolving energy mix.
As world economies evolve and the shift from fossil fuels continues, we will likely see economic complexity increase across the board.
Images: Visual Capitalist
Subscribe to our free @AuManufacturing newsletter here.


More in this section


@aumanufacturing Sections
Analysis and Commentary Awards Defence Manufacturing News Podcast Technology Videos